Researchers at Kanazawa University report in The Journal of Physical Chemistry Letters on how to simulate 3D atomic force microscopy images of out-of-equilibrium systems involving biomolecules. The approach makes use of a celebrated equation from thermodynamics applicable to non-equilibrium situations.
Three-dimensional atomic force microscopy (3D-AFM) is a technique used for probing the distribution of solvent molecules at solid-liquid interfaces. Initially applied for studying situations where the solvent is water, the method is now also being used for other molecules.
A recent development is to use 3D-AFM for resolving the organization of biopolymers such as chromosomes or proteins within cells. Due to the complexity of such systems, however, simulations of the 3D-AFM imaging process are needed to assist with its interpretation.
Simulation methods developed so far have assumed that the probed system is in equilibrium during the AFM scan cycle. This limits their validity to situations where the solvent molecules move much faster than the scanning probe.
Now, Takeshi Fukuma from Kanazawa University and colleagues have developed a 3D-AFM simulation approach that works for systems not in equilibrium, applicable to situations where molecular motion happens on timescales comparable to or larger than that of the AFM probing cycle.
The basic principle of AFM is to make a very small tip, attached to a cantilever, scan a sample’s surface. The tip’s response to height differences in the scanned surface provides structural information of the sample.
In 3D-AFM, the tip is made to penetrate the sample, and the force experienced by the tip is the result of interactions with nearby (parts of) molecules. For a given horizontal (xy) position of the tip, the dependence of the force F on the tip’s vertical (z)position as it penetrates into the sample is captured in a force-distance (F versus z) curve. Combining all force-distance curves obtained during the xy scan gives the 3D-AFM image.
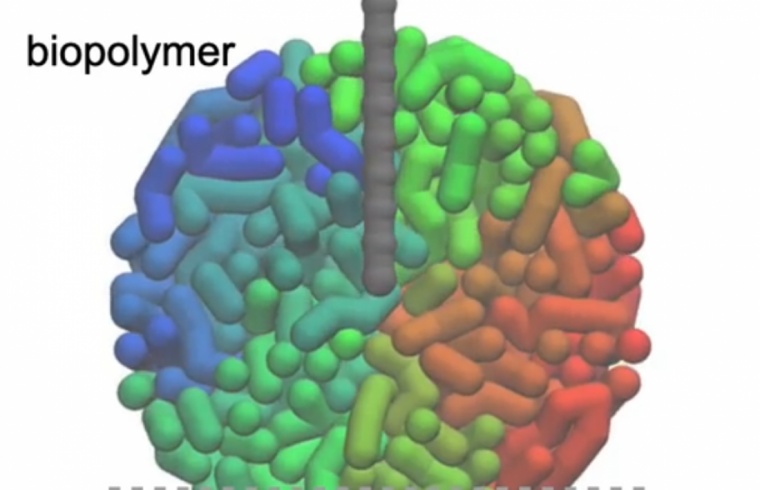
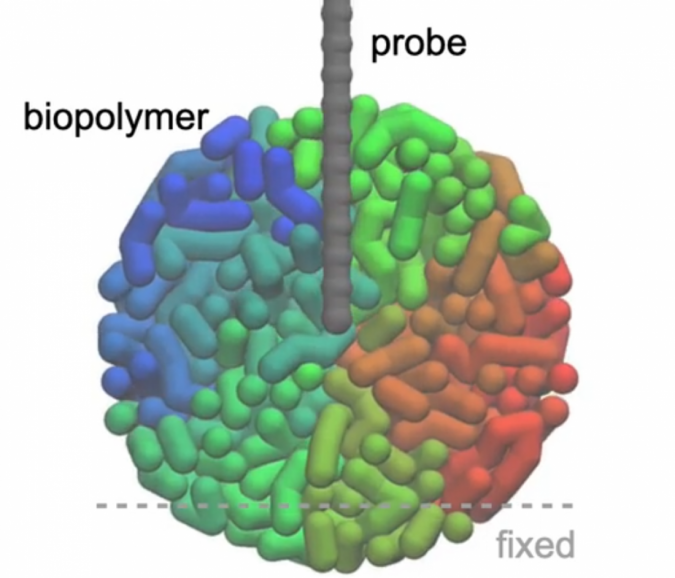
Fukuma and colleagues considered the situation where an AFM tip probes a globular biopolymer, and modeled both tip and molecule as beads connected by springs (2000 beads for the molecule, 50 beads for the tip). They calculated the force-distance curves by using the so-called Jarzynski equality, an equation that relates the free energy difference between two states of a system to the work (proportional to the force) required to go from one state to the other. Importantly, equality holds for non-equilibrium situations.
The researchers were able to show that the simulations reproduced the internal structure of the biopolymer, with some fiber features being clearly observable. They also looked at how the scanning velocity affects the simulation results and found that there is an optimum velocity range for the vertical (z) scan. Finally, Fukuma and colleagues simulated 3D-AFM images of cytoskeleton fibers for which experimentally obtained 3D-AFM images exist and found that the simulations agree well with the experiment.
The scientists, therefore, concluded that their method “is applicable to various fibers in cells such as DNA and so on by changing parameters such as stiffness, providing an important theoretical base for such experimental measurements.”

